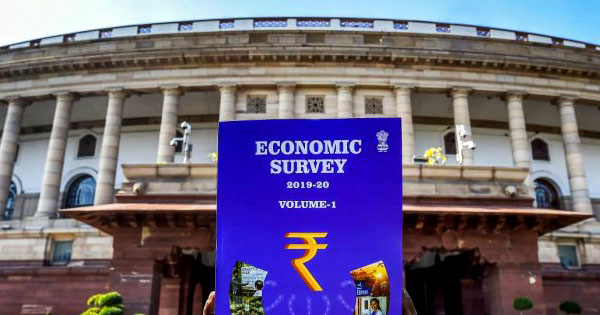
What is Economic Survey?
Economic Survey is the flagship annual document of the Ministry of finance. It gives a detailed account of the various sectors of the economy and overall economic scenario of the country in the past year and provides an outline for the year ahead. Increasingly it has also become a forum for analysis and research on the economy, and hence also a source of policy ideas.
Who prepares the Economic Survey?
The Economic Survey is prepared by the Economic Division of the Department of Economic Affairs in the Finance Ministry under the overall guidance of the Chief Economic Adviser. After receiving inputs from the senior officers in the Ministry of Finance, the final version of the Economic Survey is scrutinized by the Finance Secretary and finally approved by the Union Finance Minister.

Highlights of Economic survey of India 2019
With India having become the fifth largest economy in the world in 2019 and aspiring to be the third largest by 2025, it is only befitting to go back to one of the foundational questions posed by Smith, “What causes wealth and prosperity of nations?” Prime Minister highlighted in India’s 73rd Independence Day Speech on 15th August 2019 that only when wealth is created will wealth be distributed. Therefore, a feeling of suspicion and disrespect towards India’s wealth creators is ill advised in this context, Economic Survey 2019-20 attempts to put to rest any skepticism about the benefits accruing from a market economy, both in economic thinking and policymaking.
- The Survey points out that ideas of wealth creation are rooted in India’s old and rich tradition ranging from Kautilya’s Arthashastra to Thiruvalluvar’s Thirukural, which emphasizes ethical wealth creation as a noble human pursuit.
- Maddison (2007) provides the historical evidence that India has been the dominant economic power globally for more than three-fourths of known economic history.
- Such dominance manifests by design; not by any coincidence.
- The Survey draws on literature describing the ancient system to show that the invisible hand of the market supported by the hand of trust led to such dominance.
- The Survey’s conceptualisation of wealth creation, thus, presents a synthesis of the old and the new, be it in the combination of ancient Indian tradition with contemporary evidence or in suggesting the use of FinTech for our Public Sector Banks.
- The survey cover conveys synthesis as well, with the lavender of the new “100 Rs note” coming together with the one of older currency notes – that of Rs. 100.
Wealth Creation: The Invisible Hand Supported by the Hand of Trust
“Make money – there is no weapon sharper than it to sever the pride of your foes.”
-Thiruvalluvar
- For more than three-fourths of known economic history, India has been the dominant economic power globally.
- Such dominance manifested by design. During much of India’s economic dominance, the economy relied on the invisible hand of the market for wealth creation with the support of the hand of trust.
- Specifically, the invisible hand of markets, as reflected in openness in economic transactions, was combined with the hand of trust by appealing to ethical and philosophical dimensions.
- The Survey shows that contemporary evidence following the liberalization of the Indian economy support the economic model advocated in our traditional thinking.
- The Survey shows clearly that sectors that were liberalized grew significantly faster than those that remain closed.
- The events in the financial sector during 2011-13 and the consequences that followed from the same illustrate the second pillar – the need for the hand of trust to support the invisible hand.
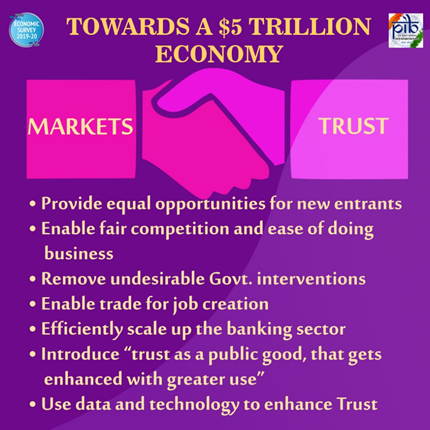
- The Survey tells that India’s aspiration to become a $5 trillion economy depends critically on strengthening the invisible hand of markets together with the hand of trust that can support markets.
- The invisible hand needs to be strengthened by promoting pro-business policies to provide equal opportunities for new entrants, enable fair competition and ease doing business. eliminate policies that undermine markets through government intervention even where it is not necessary. enable trade for job creation. efficiently scale up the banking sector to be proportionate to the size of the Indian economy.
Entrepreneurship and Wealth Creation at the Grassroots
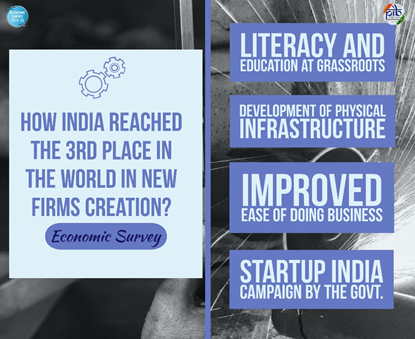
- The “Startup India” campaign of the Government of India recognizes entrepreneurship as an increasingly important strategy to fuel productivity growth and wealth creation in India.
- Given this initiative, the survey examines the content and drivers of entrepreneurial activity at the bottom of the administrative pyramid – over 500 districts in India.
- The analysis employs comprehensive data on new firm creation in the formal sector across all these districts from the Ministry of Corporate Affairs (MCA)-21 database.
- Using the World Bank’s Data on Entrepreneurship, the survey confirms that India ranks third in number of new firms created.
- The same data shows that new firm creation has gone up dramatically in India since 2014.
- While the number of new firms in the formal sector grew at a compounded annual growth rate of 3.8 per cent from 2006-2014, the growth rate from 2014 to 2018 has been 12.2 per cent.
- Reflecting India’s new economic structure, i.e. comparative advantage in the Services sector, new firm creation in services is significantly higher than that in manufacturing, infrastructure or agriculture.
- Entrepreneurship at the bottom of the administrative pyramid – a district – has a significant impact on wealth creation at the grassroot level. This impact of entrepreneurial activity on GDDP (Gross District Domestic Product) is maximal for the manufacturing and services sectors
- Birth of new firms is very heterogeneous across Indian districts and across sectors. Moreover, it is dispersed across India and is not restricted to just a few cities.
- Literacy and education in the district foster local entrepreneurship significantly. For instance, the eastern part of India has the lowest literacy rate of about 59.6 per cent according to the census of 2011.
- This is also the region in which new firm formation is the lowest. In fact, the impact of literacy on entrepreneurship is most pronounced when it is above 70 per cent.
- The level of local education and the quality of physical infrastructure in the district influence new firm creation significantly
- Finally, policies that enable ease of doing business and flexible labour regulation enable new firm creation, especially in the manufacturing sector.
- As the manufacturing sector has the greatest potential to create jobs for our youth, enhancing ease of doing business and implementing flexible labour laws can create the maximum jobs in districts and thereby in the states. Literacy, education and physical infrastructure are the other policy levers that district and state administrations must focus on foster entrepreneurship and thereby job creation and wealth creation.
Pro-Business versus Pro-Crony
- Survey says that India’s aspiration of becoming a $5 trillion economy depends critically on policy decisions.
- Promoting ‘pro-business’ policy that unleashes the power of competitive markets to generate wealth.
- Weaning away from ‘pro-crony’ policy that may favour specific private interests, especially powerful incumbents.
- Pro-crony policies such as discretionary allocation of natural resources till 2011 led to rent-seeking by beneficiaries while competitive allocation of the same post 2014 ended such rent extraction.
- Similarly, crony lending that led to wilful default, wherein promoters collectively siphoned off wealth from banks, led to losses that dwarf subsidies for rural development.
Undermining Markets: When Government Intervention Hurts More Than It Helps
- Government intervention, though well intended, often ends up undermining the ability of the markets to support wealth creation and leads to outcomes opposite to those intended.
- Frequent and unpredictable imposition of blanket stock limits on commodities under ECA distorts:
- The incentives for the creation of storage infrastructure by the private sector.
- Movement up the agricultural value chain.
- Development of national market for agricultural commodities.
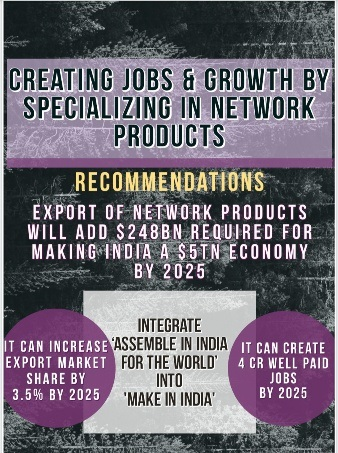
Creating Jobs and Growth by Specializing in Network Products
- Survey says India has unprecedented opportunity to chart a China-like, labour-intensive, export trajectory.
- By integrating “Assemble in India for the world” into Make in India.
- India can Raise its export market share to about 3.5 % by 2025 and 6 % by 2030. o Create 4 crore well-paid jobs by 2025 and 8 crores by 2030.
- Exports of network products can provide one-quarter of the increase in value added required for making India a $5 trillion economy by 2025.
- Survey suggests a strategy similar to one used by China to grab this opportunity
- Specialization at large scale in labour-intensive sectors, especially network products.
- Laser-like focus on enabling assembling operations at mammoth scale in network products.
- Export primarily to markets in rich countries.
- Trade policy must be an enabler.
- Survey analyses the impact of India’s trade agreements on overall trade balance.
- India’s exports increased by 13.4 % for manufactured products and 10.9 % for total merchandise
- Imports increased by 12.7 % for manufactured products and 8.6 per cent for total merchandise.
- India gained 0.7 % increase in trade surplus per year for manufactured products and 2.3 % per year for total merchandise.
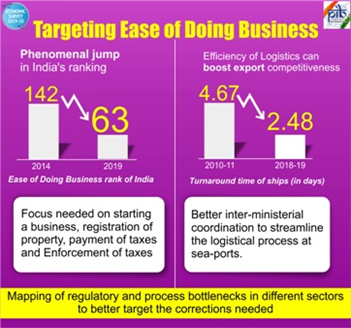
Targeting Ease of Doing Business in India
- A jump of 79 positions to 63 in 2019 from 142 in 2014 in World Bank’s ease of doing Business rankings.
- India still trails in parameters such as Ease of Starting Business, Registering Property, Paying Taxes and Enforcing Contracts.
Golden jubilee of bank nationalisation: Taking stock
- Survey observes 2019 as the golden jubilee year of bank nationalization
- Since 1969, India’s Banking sector has not developed proportionately to the growth in the size of the economy.
- India has only one bank in the global top 100 – same as countries that are a fraction of its size.
- A large economy needs an efficient banking sector to support its growth.
- The onus of supporting the economy falls on the PSBs (Public Sector Banks) accounting for 70 % of the market share in Indian banking
- PSBs are inefficient compared to their peer groups on every performance parameter.
- In 2019, investment for every rupee in PSBs, on average, led to the loss of 23 paise, while in NPBs it led to the gain of 9.6 paise.
- Credit growth in PSBs has been much lower than NPBs for the last several years.
Solutions to make PSBs more efficient:
- Employee Stock Ownership Plan (ESOP) for PSBs’ employees
- Representation on boards proportionate to the blocks held by employees to incentivize employees and align their interests with that of all shareholders of banks.
- Creation of a GSTN type entity that will aggregate data from all PSBs and use technologies like big data, artificial intelligence and machine learning in credit decisions for ensuring better screening and monitoring of borrowers, especially the large ones.

Privatization and Wealth Creation
- Survey examines the realized efficiency gains from privatization in the Indian context and bolsters the case for aggressive disinvestment of CPSEs.
- Strategic disinvestment of Government’s shareholding of 53.29 per cent in HPCL led to an increase of around Rs. 33,000 crores in national wealth.
- Survey presents an analysis of the before-after performance of 11 CPSEs which underwent strategic disinvestment from 1999-2000 to 2003-04:
- Financial indicators such as net worth, net profit, return on assets (ROA), return on equity (ROE) etc of the privatized CPSEs, on an average, have improved significantly. o Privatized CPSEs have been able to generate more wealth from the same resources.
Survey suggests aggressive disinvestment of CPSEs to:
- Bring in higher profitability.
- Promote efficiency.
- Increase competitiveness.
- Promote professionalism.
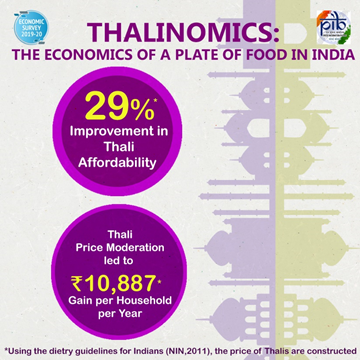
Thalinomics: The Economics of a Plate of Food in India
- An attempt to quantify what a common person pays for a Thali across India.
- A shift in the dynamics of Thali prices since 2015-16.
- Absolute prices of a vegetarian Thali have decreased significantly since 2015-16 across India and the four regions; though the price has increased during 2019-20.
- Post 2015-16: Average household gained close to Rs. 11, 000 on average per year from the moderation in prices in the case of vegetarian Thali.
- Average household that consumes two non-vegetarian Thalis gained close to Rs. 12, 000 on average per year during the same period.
- From 2006-07 to 2019-20: Affordability of vegetarian Thalis improved 29 %.
- Affordability of non-vegetarian Thalis improved by 18 %.
India’s Economic Performance in 2019-20
- India’s GDP growth moderated to 4.8 % in First half of 2019-20, amidst a weak environment for global manufacturing, trade and demand.
- Growth for ‘Agriculture and allied activities’ and ‘Public administration, defence, and other services’ in H1 of 2019-20 was higher than in H2 of 2018-19.
- India’s external sector gained further stability in first half of 2019-20:
- Current Account Deficit (CAD) narrowed to 1.5 % of GDP in first half of 2019-20 from 2.1 % in 2018-19.
- Impressive Foreign Direct Investment (FDI). Rebounding of portfolio flows.
- Accretion of foreign exchange reserves.
- Sharper contraction of imports as compared to that of exports in first half of 2019-20, with easing of crude prices.
- Headline inflation expected to decline by year end
External Sector
- Balance of Payments (BoP): India’s BoP position improved from US$ 412.9 bn of forex reserves in end March 2019 to US$ 433.7 bn in end September 2019.
- Current account deficit (CAD) narrowed from 2.1% in 2018-19 to 1.5% of GDP in H1 of 2019-20.
- Foreign reserves stood at US$ 461.2 bn as on 10th January 2020.
- Global trade: In sync with an estimated 2.9% growth in global output in 2019, global trade is estimated to grow at 1.0% after having peaked in 2017 at 5.7%.
- However, it is projected to recover to 2.9% in 2020 with recovery in global economic activity.
- India’s merchandise trade balance improved from 2009-14 to 2014-19, although most of the improvement in the latter period was due to more than 50% decline in crude prices in 2016-17.
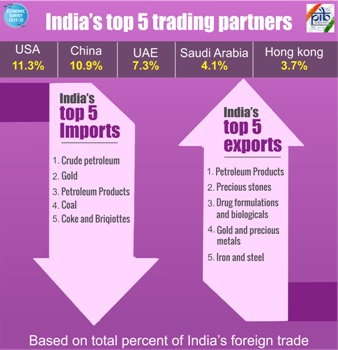
- India’s top five trading partners continue to be USA, China, UAE, Saudi Arabia and Hong Kong.
Exports
- Top export items: Petroleum products, precious stones, drug formulations & biologicals, gold and other precious metals.
- Largest export destinations in 2019-20 (April-November): United States of America (USA), followed by United Arab Emirates (UAE), China and Hong Kong.
Imports
- Top import items: Crude petroleum, gold, petroleum products, coal, coke & briquettes.
- India’s imports continue to be largest from China, followed by USA, UAE and Saudi Arabia.
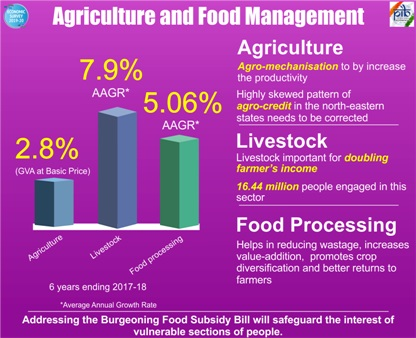
Agriculture and Food Management
- The share of agriculture and allied sectors in the total Gross Value Added (GVA) of the country has been continuously declining on account of relatively higher growth performance of non-agricultural sectors, a natural outcome of development process.
- GVA at Basic Prices for 2019-20 from ‘Agriculture, Forestry and Fishing’ sector is estimated to grow by 2.8 %.
- Agricultural productivity is also constrained by lower level of mechanization in agriculture which is about 40 % in India, much lower than China (59.5 %) and Brazil (75 %).
Industry and Infrastructure
- The industrial sector as per Index of Industrial Production (IIP) registered a growth of 0.6 per cent in 2019-20 (April-November) as compared to 5.0 % during 2018-19 (April-November).
- Fertilizer sector achieved a growth of 4.0 % during 2019-20 (April November) as compared to (-) 1.3 per cent during 2018-19 (April November).
- Steel sector achieved a growth of 5.2 % during 2019-20 (April November) as compared to 3.6 % during 2018-19 (April-November).
- Total telephone connections in India touched 119.43 crore as on September 30, 2019.
- The installed capacity of power generation has increased to 3, 64,960 MW as on October 31, 2019 from 3, 56,100 MW as on March 31, 2019.
- Services Sector · Gross Value-Added growth of the services sector moderated in 2019-20 as suggested by various high-frequency indicators and sectoral data such as air passenger traffic, port and shipping freight traffic, bank credit etc.
- On the bright side, FDI into services sector has witnessed a recovery in early 2019-20.